# Core Web Vitals: what LCP, INP and CLS measure, and how to fix each
> Core Web Vitals are LCP, INP and CLS, judged at the 75th percentile of real visits. Thresholds, how to measure them in the field, and how to fix each one.
- URL: https://computese.com/core-web-vitals/
- Author: Duong Quan Nguyen, CEO, Computese
- Published: 2026-10-06
- Updated: 2026-10-09
- Topics: Web development, SEO
## In short
- Core Web Vitals are LCP (loading), INP (responsiveness) and CLS (visual stability), judged at the 75th percentile of real visits: 2.5 seconds or less, 200 milliseconds or less and 0.1 or less, for mobile and desktop separately.
- Google says its ranking systems use Core Web Vitals, but good scores do not guarantee rankings and relevance still comes first. Fix Poor URLs first and stop at Good unless your own conversion data says to go further.
- Field data (Search Console, PageSpeed Insights, your own RUM) decides what to fix; lab data (Lighthouse, DevTools) explains why. INP needs a real interaction, so Total Blocking Time is only a lab proxy for it.
- Split LCP into time to first byte, resource load delay, resource load duration and element render delay, and remove the two delays first: a discoverable, high-priority, non-lazy LCP image in server-rendered HTML.
- Fix by template, then wait: CrUX covers a trailing 28 days and Search Console validation monitors for 28 days, so a fix shows slowly. Your own RUM data shows it sooner.
Core Web Vitals are Google's three measures of experience on real visits: Largest Contentful Paint (LCP) for loading, Interaction to Next Paint (INP) for responsiveness and Cumulative Layout Shift (CLS) for visual stability. A page passes when its 75th percentile is good on all three: LCP 2.5 seconds or less, INP 200 milliseconds or less, CLS 0.1 or less.
This guide covers what each metric counts, how to read field and lab data, and how to fix LCP, INP and CLS, ending with a workflow for a failing template. For the wider audit these metrics sit in, see our [technical SEO guide](https://computese.com/technical-seo/); for the phone side of the same work, [mobile optimization](https://computese.com/mobile-optimization-for-your-website/).
## What are the Core Web Vitals, and what counts as good?
| Metric | Measures | Good | Needs improvement | Poor |
| ------ | ------------------------------------------------------------------------------ | -------------- | ----------------- | ----------- |
| LCP | Loading: when the largest image, video frame or text block in view is painted | 2.5 s or less | up to 4 s | over 4 s |
| INP | Responsiveness: the slowest click, tap or key press, from input to next frame | 200 ms or less | up to 500 ms | over 500 ms |
| CLS | Visual stability: unexpected movement of visible content (a score, not a time) | 0.1 or less | up to 0.25 | over 0.25 |
[web.dev](https://web.dev/articles/vitals) judges each metric at the 75th percentile of page loads, segmented across mobile and desktop, and says a tool should count a page as passing only when all three meet their targets. The percentile was [chosen](https://web.dev/articles/defining-core-web-vitals-thresholds) so most visits reach the target without a few outliers deciding the verdict, and both device classes share the same thresholds. Mobile pass rates are lower: in the [2025 Web Almanac](https://almanac.httparchive.org/en/2025/performance), 48% of mobile websites had good Core Web Vitals against 56% of desktop ones.
Each metric has rules that decide how its number can move:
- **LCP** is the render time of the largest image, text block or video in the viewport, [counted from the start of navigation](https://web.dev/articles/lcp), so server time is part of it. Candidates are images, videos (the poster image or the first frame, whichever is earlier), elements with a CSS `url()` background and block-level text; invisible elements, full-viewport backgrounds and low-entropy placeholder images are ignored, and measurement stops at the first tap, scroll or key press.
- **INP** [observes](https://web.dev/articles/inp) every click, tap and key press during a visit (hovering, scrolling and zooming do not count) and reports the longest, ignoring one highest interaction for every 50 so a single hiccup on a busy page does not decide it. A page nobody clicks, taps or types on has no INP value.
- **CLS** [counts a layout shift](https://web.dev/articles/cls) when a visible element changes its start position between two frames. A shift scores its impact fraction times its distance fraction: in web.dev's example, an element covering half the viewport that drops by a quarter of the viewport height scores 0.75 × 0.25 = 0.1875, one shift already past the "good" limit. A page's CLS is its worst session window, a burst of shifts less than one second apart and no longer than five seconds in total. Shifts within 500 milliseconds of a tap, click or key press are excluded; scrolls, drags and pinch-zooms earn no such exemption.
Old advice still circulates, so the dates matter. Chrome introduced the Core Web Vitals in [early 2020](https://developers.google.com/search/blog/2023/05/introducing-inp) with First Input Delay (FID) as the responsiveness metric. INP, experimental since May 2022, [replaced FID on March 12, 2024](https://web.dev/blog/inp-cwv-march-12). CLS once summed every shift in a page's life; it now takes the largest burst. As of October 2026 web.dev lists all three metrics as stable and says stable Core Web Vitals won't change more than once a year, and the thresholds above match the [Search Console report's](https://support.google.com/webmasters/answer/9205520).
## Do Core Web Vitals affect Google rankings?
To a limited, specific degree. Google's [page experience documentation](https://developers.google.com/search/docs/appearance/page-experience) says Core Web Vitals are used by its ranking systems, and that there is no single "page experience signal": the core ranking systems look at a variety of signals that align with overall page experience. Other page experience aspects do not directly help a page rank, though they can make a site more satisfying to use.
The same page sets the limits. Good results in Search Console or third-party tools do not guarantee a top position. Google says it still shows the most relevant content when page experience is poor, and that a great page experience can contribute to success when many helpful results compete.
Treat the thresholds as a floor to clear, not a lever to keep pulling. Google says trying for a perfect score just for SEO reasons may not be the best use of your time, and [Search Console's advice](https://support.google.com/webmasters/answer/9205520) is to fix everything labelled Poor first, then rank the rest by how many URLs they affect or how important those URLs are. Many sites do gain from going beyond Good, but web.dev says to [judge that against your own business metrics](https://web.dev/articles/defining-core-web-vitals-thresholds). For how the ranking systems fit together, see [how the Google search engine works](https://computese.com/how-google-search-engine-works/).
## How do you measure Core Web Vitals, and why do lab and field data disagree?
Field data records real visits; lab data is one scripted page load. web.dev's [rule](https://web.dev/articles/lab-and-field-data-differences) is to use field data to decide what to fix and lab data to find the cause and test the fix.
| Tool | Data | Use it to |
| ------------------------------------------------------------------------------------------------- | ----------------------------------------------------------------------------------------- | ------------------------------------------- |
| [Search Console, Core Web Vitals report](https://support.google.com/webmasters/answer/9205520) | CrUX field data for groups of similar indexed URLs, mobile and desktop, last 28 days | Find which templates fail |
| [PageSpeed Insights](https://developers.google.com/speed/docs/insights/v5/about) | CrUX field data (trailing 28 days) plus a Lighthouse run, for one URL or the whole origin | Check one URL; read the field section first |
| [web-vitals library](https://github.com/GoogleChrome/web-vitals) | Your own RUM, every visit in supporting browsers | See which element, sub-part or interaction |
| Lighthouse and [Chrome DevTools](https://developer.chrome.com/docs/devtools/performance/overview) | Lab, with field data overlaid and live LCP, INP and CLS in DevTools | Reproduce, debug and verify |
The two disagree for reasons that are not bugs:
- A field value is one point on a distribution. In web.dev's example 88% of visits had an LCP of 2.5 seconds or less and the 75th percentile was 1.8 seconds, while a lab run of the same page said 3.0 seconds. All three numbers are valid.
- Visitors see different LCP elements (screen size, personalization, A/B tests, installed fonts) and a lab run always sees one. A lab load also typically starts with a cold cache and never benefits from the back/forward cache.
- INP needs a real interaction, which a Lighthouse page load does not make. Total Blocking Time is [a proxy, not a substitute](https://web.dev/articles/tbt).
CrUX, the source of the field numbers in Search Console and PageSpeed Insights, has [blind spots](https://developer.chrome.com/docs/crux/methodology). It collects from Chrome users who enabled usage statistics and history sync, on desktop Chrome and Chrome for Android; Chrome on iOS, WebView apps and other Chromium browsers such as Edge are not included. A page must be publicly discoverable and have enough visitors. Where a URL has too little data PageSpeed Insights falls back to the origin, and with none at all it shows no real-user data, so a low-traffic site needs its own RUM. PageSpeed Insights passes an assessment when all three 75th percentiles are good, or LCP and CLS alone when INP has [too little data](https://developers.google.com/speed/docs/insights/v5/about).
The web-vitals library is about 3 KB brotli-compressed, and its attribution build adds about 1.5 KB and the diagnosis. This sends each value with the one fact that explains it:
```js
import { onCLS, onINP, onLCP } from "web-vitals/attribution";
function send({ name, value, rating, id, attribution: a }) {
const why = {
LCP: {
element: a.target,
ttfb: a.timeToFirstByte,
loadDelay: a.resourceLoadDelay,
loadDuration: a.resourceLoadDuration,
renderDelay: a.elementRenderDelay,
},
INP: {
element: a.interactionTarget,
inputDelay: a.inputDelay,
processing: a.processingDuration,
presentation: a.presentationDelay,
},
CLS: { element: a.largestShiftTarget },
}[name];
const body = { name, value, rating, id, path: location.pathname, ...why };
navigator.sendBeacon("/vitals", JSON.stringify(body)); // your endpoint
}
[onLCP, onINP, onCLS].forEach((observe) => observe(send));
```
CLS and INP report each time the page is hidden, and every metric reports again after a back/forward cache restore with a new `id`, so keep only the last value for each `id` when you aggregate.
## How do you fix a slow LCP?
Find the LCP element (PageSpeed Insights, the DevTools Performance panel, or `attribution.target` above), then split its time into four parts that add up to the whole with no gap or overlap, [as web.dev breaks it down](https://web.dev/articles/optimize-lcp):
| Sub-part | What it covers | Share on a well-optimized page |
| ------------------------- | ------------------------------------------------------------------------------- | ------------------------------ |
| Time to First Byte (TTFB) | Start of navigation until the first byte of HTML arrives | about 40% |
| Resource load delay | TTFB until the browser starts loading the LCP resource (0 for system-font text) | under 10% |
| Resource load duration | Time to download the LCP resource | about 40% |
| Element render delay | LCP resource finished until the element is fully painted | under 10% |
The shares are guidelines, and web.dev advises against turning them into absolute times. A large "delay" part is where to start. Suppose a page has a 4.0 second LCP (an invented example) split into 0.6 s TTFB, 1.9 s load delay, 0.7 s load duration and 0.8 s render delay. Compressing the image harder would barely help; the 1.9 seconds says the browser found the image late.
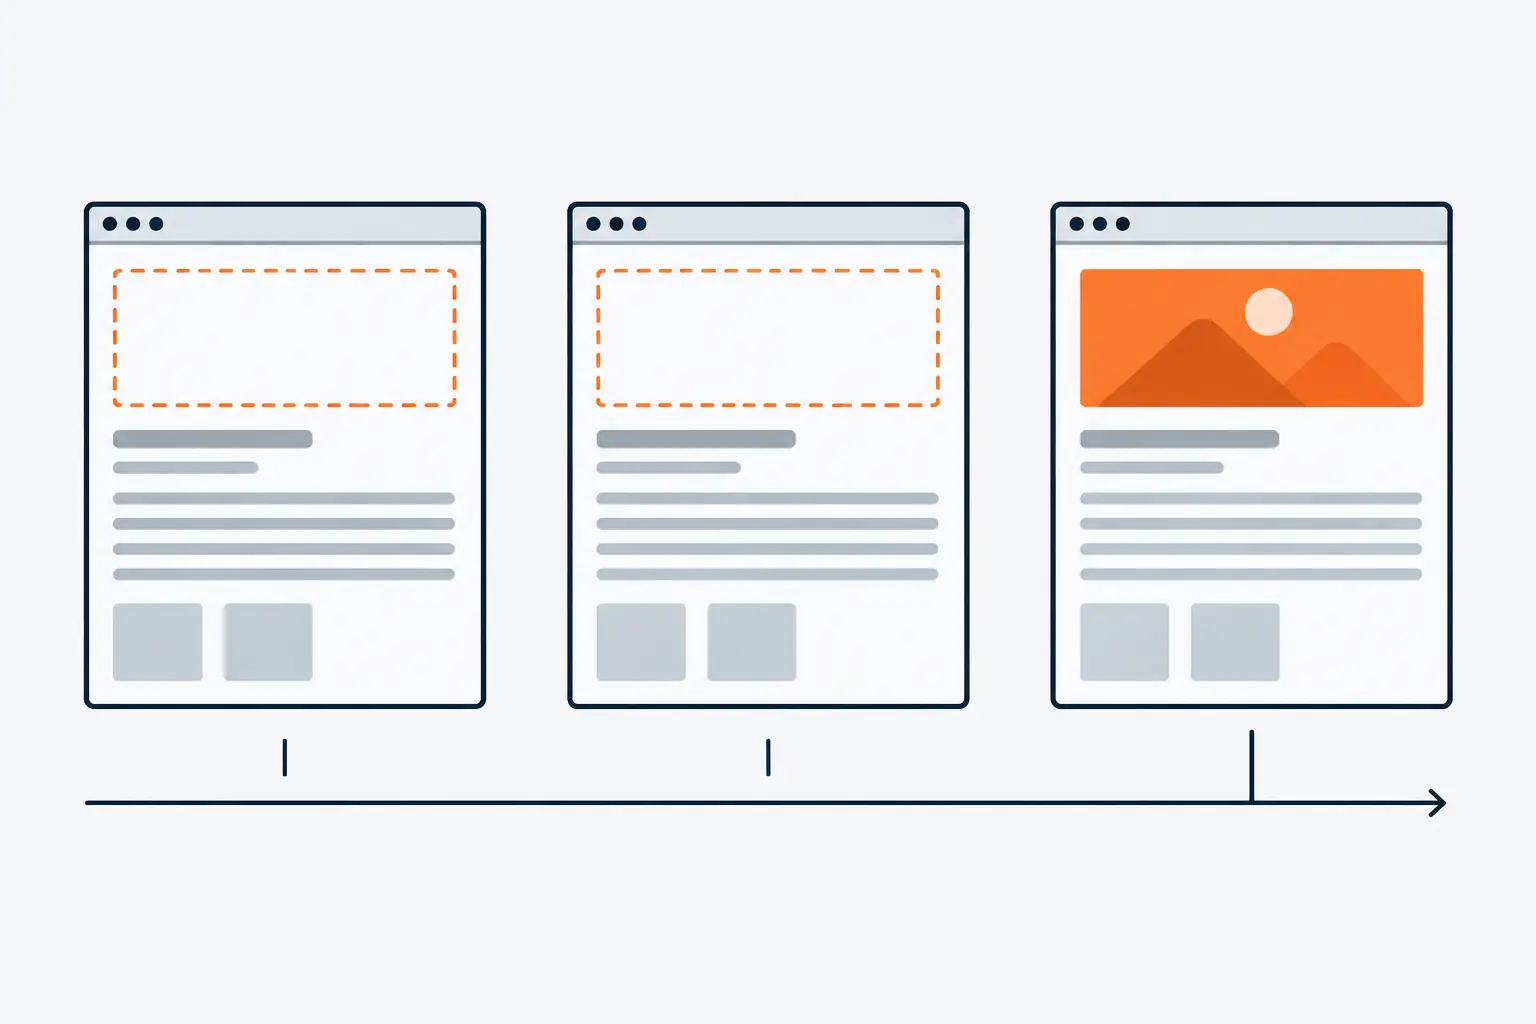
*LCP lands when the biggest element arrives, so a hero image the browser finds late finishes late however quickly the rest of the page appears.*
> [!WARNING]
> Shortening one part can just move its time to another. In web.dev's example, converting the image to AVIF or WebP made it download faster but left LCP unchanged, because the page hid the element until its JavaScript finished and the saved time reappeared as element render delay. Fix the delays before the bytes.
### Resource load delay: make the image discoverable and urgent
The browser's preload scanner can start the download early only if the image is in the HTML response. An `` with `src` or `srcset` in the markup qualifies; an image added by JavaScript, hidden behind `data-src` or set as a CSS background does not. Then raise its priority and make sure it is not lazy:
```html
```
web.dev says to [never lazy-load the LCP image](https://web.dev/articles/optimize-lcp) and to give `fetchpriority="high"` to one or two images at most, because more makes the hint useless. In a test that rewrote the Google Flights page with Cloudflare Workers, [the hint moved LCP from 2.6 to 1.9 seconds](https://web.dev/articles/fetch-priority); all three major engines support it, Firefox since version 132 and Safari since 17.2. The 2025 Web Almanac found about 16% to 17% of pages still lazy-loading their LCP image.
### Element render delay: stop blocking the paint
All browsers render images on the main thread, so anything that holds it up delays the paint even after the file arrives. The usual causes are a stylesheet slower to load than the image (inline it if it is small, otherwise remove unused rules and defer non-critical CSS), synchronous scripts in the ``, content that only exists once JavaScript has run, an A/B-testing library hiding the element until it picks a variant, and long tasks. Render the LCP content on the server: [server-side rendering puts the image in the HTML](https://web.dev/articles/optimize-lcp) and removes the wait for scripts. It costs extra server time, so prerender at build time where the architecture allows.
### Resource load duration: send fewer bytes from nearer
This is rarely the bottleneck. web.dev warns that load duration tends not to be a significant one, and the Chrome team found that [most origins with poor LCP spend under 10% of their 75th percentile LCP downloading the image](https://web.dev/articles/top-cwv). Check the sub-part before compressing anything. If it is large, send the size the screen needs with `srcset` and `sizes`, use AVIF or WebP, host the image on the page's own origin or preconnect to its origin, and set a long cache lifetime so repeat visits skip the network. Compress text assets too; our guide to [data compression algorithms](https://computese.com/revolutionary-data-compression-algorithm/) explains Brotli and gzip.
### Time to First Byte: cache the HTML
Nothing starts until the first byte arrives, so every other sub-part inherits a slow TTFB. It is not a Core Web Vital, but [0.8 seconds or less](https://web.dev/articles/optimize-ttfb) is a sound rule of thumb. Common causes are redirect chains (link shorteners, ad and newsletter links), HTML that never gets served from a CDN edge, and unique analytics query parameters that make the cache treat every visit as a new page. Cache HTML at the edge even briefly, cut redirect hops, and keep tracking parameters from bypassing the cache. The Chrome team also recommends [aiming for instant navigations](https://web.dev/articles/top-cwv): a page prerendered with the Speculation Rules API shows a near-zero LCP, and one restored from the back/forward cache appears exactly as the user left it.
## How do you fix a poor INP?
INP is the sum of three phases, and the fix depends on which one dominates. The attribution data above reports all three, and [web.dev defines them](https://web.dev/articles/optimize-inp) this way:
| Phase | What it is | Usual causes | Fixes |
| ------------------- | -------------------------------------------- | -------------------------------------------------------------------------------------------- | -------------------------------------------------------------------------- |
| Input delay | Input until event handlers start | Long tasks, startup script evaluation, timers, overlapping interactions, third-party scripts | Ship less JavaScript, split bundles, break up tasks, drop recurring timers |
| Processing duration | Event handlers running | Heavy handlers doing all their work before the next paint | Do the minimum visible work, then yield; move computation to a web worker |
| Presentation delay | Handlers finished until the next frame shows | Large DOM, forced layout | Smaller DOM, `content-visibility`, batch DOM reads and writes |
The main thread runs one task at a time, any task over 50 milliseconds is a [long task](https://web.dev/articles/optimize-long-tasks), and an interaction that arrives mid-task waits for it.
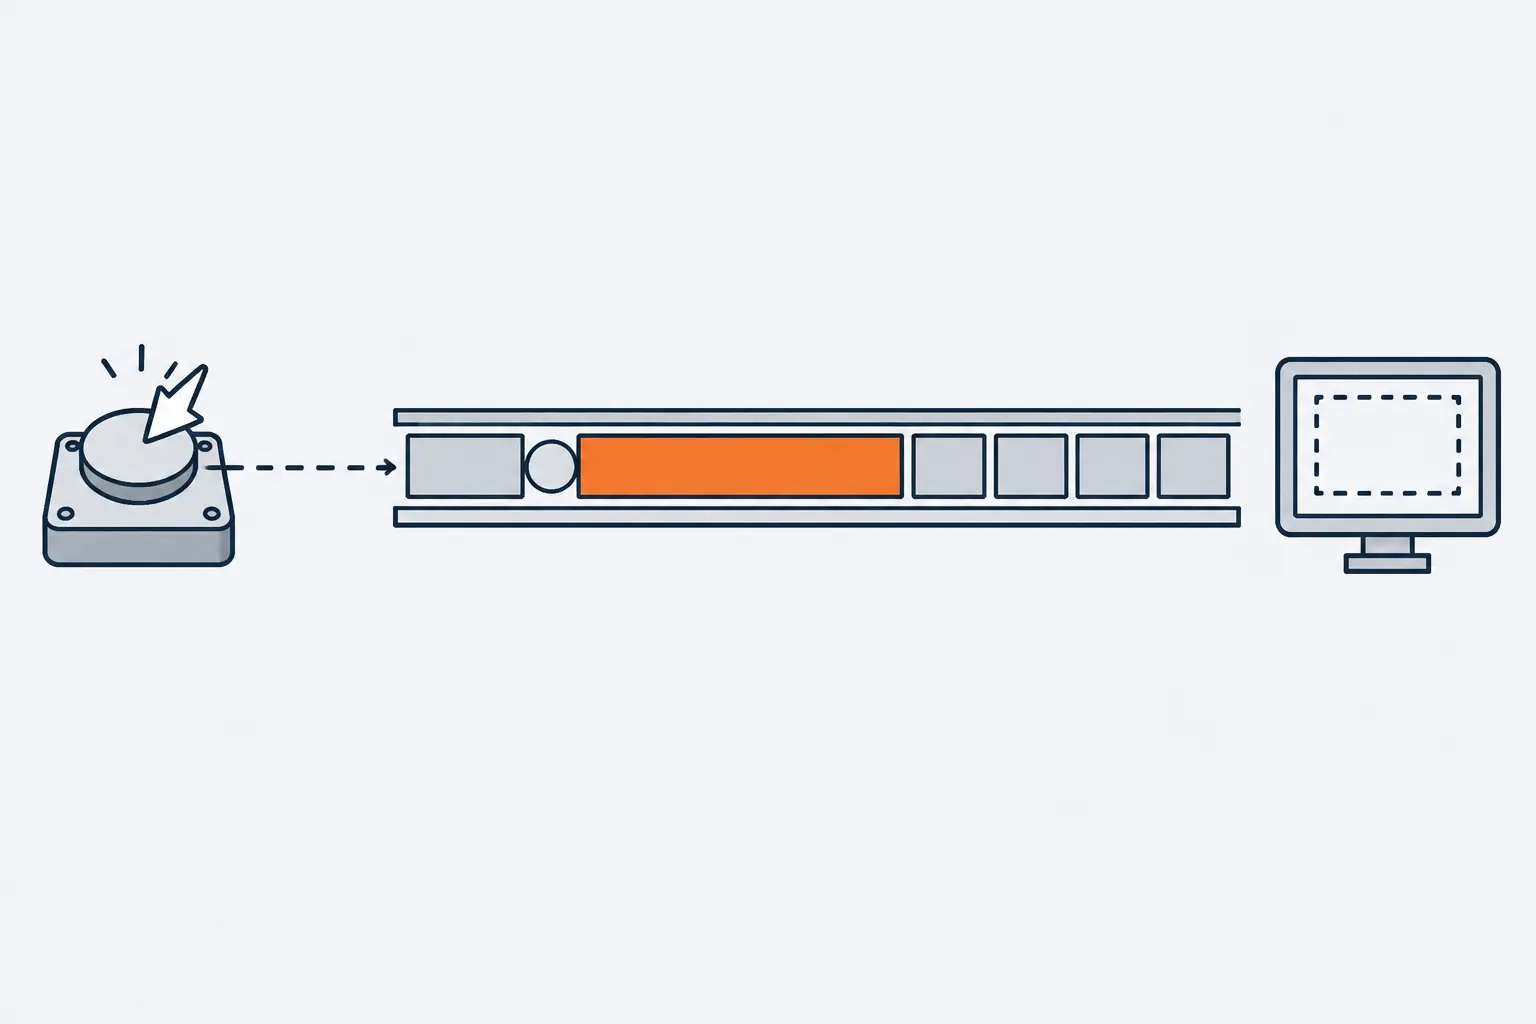
*A tap cannot jump the queue: while one long task holds the main thread, the screen cannot show any response to it.*
Break the work up and yield, putting the visible change before the yield so the browser can paint it:
```js
function yieldToMain() {
if (globalThis.scheduler?.yield) return scheduler.yield();
return new Promise((resolve) => setTimeout(resolve, 0)); // fallback
}
saveButton.addEventListener("click", async () => {
showSpinner(); // the feedback the visitor needs in the next frame
await yieldToMain(); // lets the browser paint and handle other input
await saveToServer(); // the slow work runs in a later task
});
```
`scheduler.yield()` runs the continuation before other queued tasks, so [tasks from third-party scripts](https://web.dev/articles/optimize-long-tasks) cannot cut in ahead of it, which a `setTimeout` fallback cannot promise. It works in Chrome and Edge 129 and Firefox 142, not in Safari, and [MDN lists it as limited availability](https://developer.mozilla.org/en-US/docs/Web/API/Scheduler/yield) (not Baseline) as of October 2026, so keep the fallback. web.dev no longer recommends `isInputPending()`.
Doing less beats doing it in pieces. Ship only the JavaScript the first render needs and prune tags: web.dev has seen a [correlation between the size of tag managers and poorer INP](https://web.dev/articles/tag-best-practices). For typeahead fields, [debounce the input and cancel stale requests](https://web.dev/articles/optimize-input-delay) with `AbortController`.
For presentation delay, large DOMs make every update expensive. [`content-visibility: auto`](https://web.dev/articles/content-visibility) skips rendering work for off-screen sections and became Baseline "newly available" on September 15, 2025. Pair it with a size estimate so the scrollbar does not jump:
```css
.comment {
content-visibility: auto;
contain-intrinsic-size: auto 300px; /* estimate; the browser remembers the real size */
}
```
In the lab, [Total Blocking Time](https://web.dev/articles/tbt) sums the time beyond 50 milliseconds of every long task after First Contentful Paint, and web.dev suggests staying under 200 milliseconds on average mobile hardware. It cannot see when visitors really tap, so judge INP from field data and use the DevTools live metrics view to reproduce the slow interaction the field data points to.
## How do you fix layout shift (CLS)?
web.dev lists [four common causes](https://web.dev/articles/optimize-cls): images without dimensions, ads and embeds without dimensions, dynamically injected content, and web fonts. The first is the cheapest to fix and still widespread: the 2025 Web Almanac found 62% of mobile pages failing to set explicit dimensions on at least one image. Give images and video `width` and `height`, which browsers turn into a default aspect ratio before the file loads, and reserve space for everything else:
```css
/* with in the markup */
img {
max-width: 100%;
height: auto; /* lets the width and height attributes set the ratio */
}
.embed {
aspect-ratio: 16 / 9;
}
.ad-slot {
min-height: 250px; /* the smallest size you expect; it can still grow */
}
```
Responsive images need the same aspect ratio in every `srcset` candidate. For ads and widgets whose size you cannot know, set `min-height` to the smallest likely size and accept a small shift for larger ones, and do not collapse the slot when nothing arrives, because removing reserved space shifts the page as much as adding content.
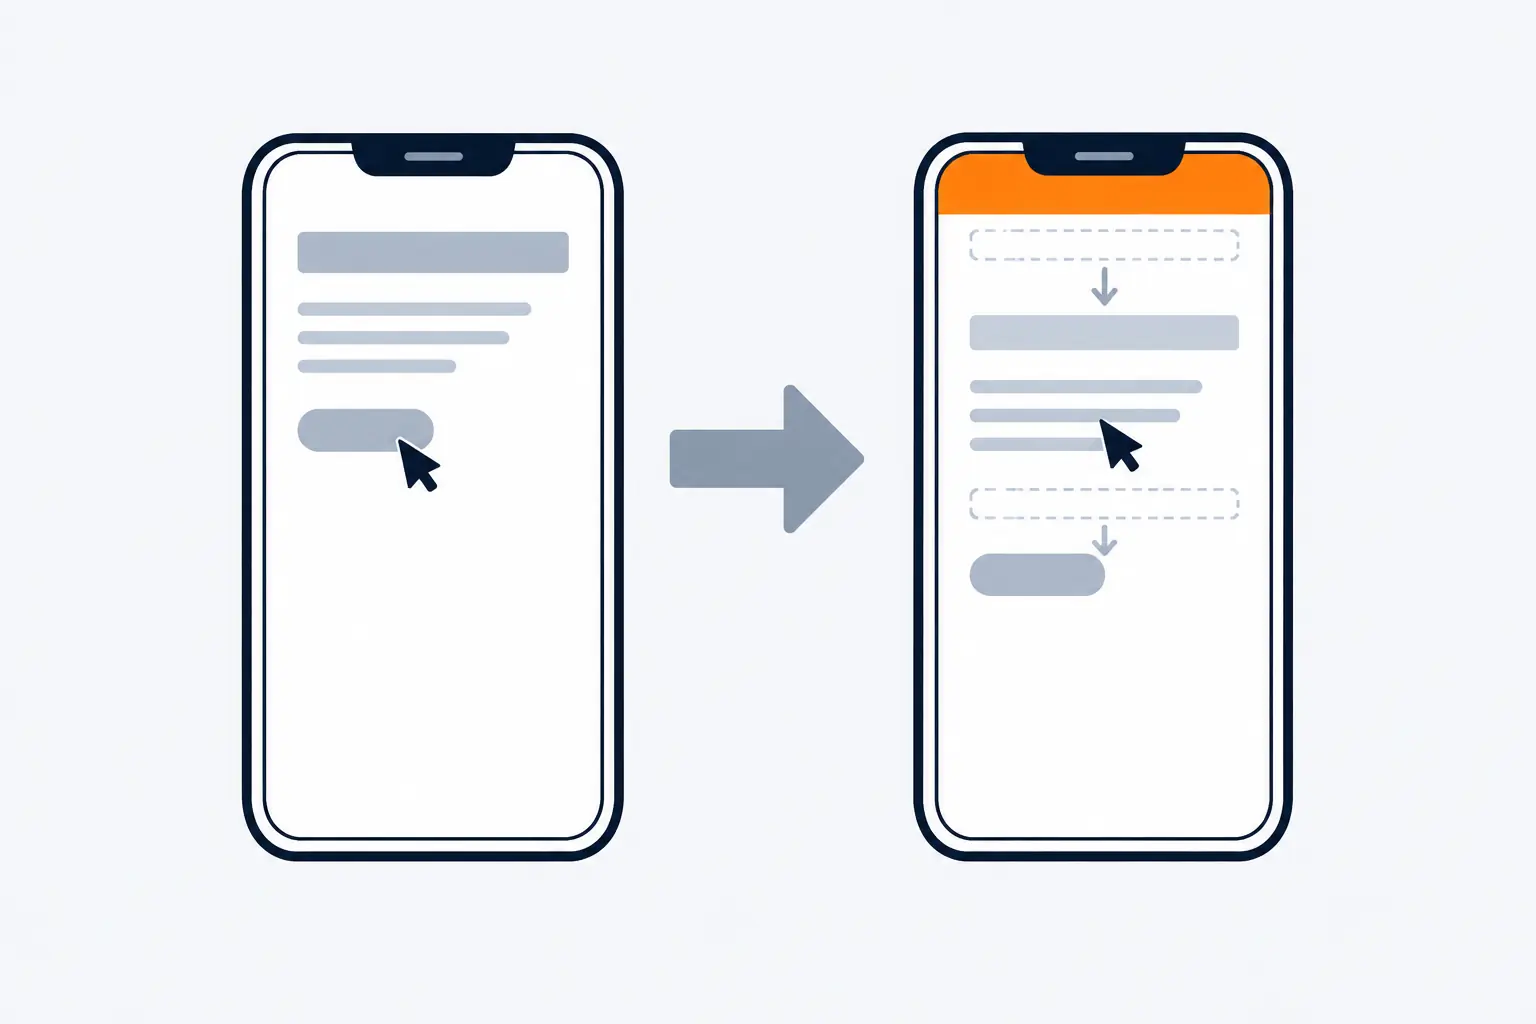
*A slot with no reserved height pushes everything below it down when it fills, which is how a tap lands on the wrong thing.*
Fonts shift text when the web font replaces its fallback. `font-display: optional` avoids that re-layout because the web font is used only if it is available at initial layout; the cost is that a late-arriving font is not used. To keep `swap`, match the fallback's metrics to the web font so the swap moves nothing:
```css
@font-face {
font-family: "Brand Sans Fallback";
src: local("Arial");
size-adjust: 104%; /* example values: generate yours from the font's metrics */
ascent-override: 92%;
descent-override: 24%;
line-gap-override: 0%;
}
body {
font-family: "Brand Sans", "Brand Sans Fallback", sans-serif;
}
```
Chrome's [font fallback guide](https://developer.chrome.com/blog/font-fallbacks) shows how to compute the values and says `next/font` in Next.js 13 and later generates matching fallbacks for you. MDN lists [`ascent-override`](https://developer.mozilla.org/en-US/docs/Web/CSS/Reference/At-rules/@font-face/ascent-override) as limited availability (not Baseline), so test in Safari.
Animating `top` or `left` shifts layout even for an element on its own layer, while `transform` animations do not. Shifts after a tap or key press are allowed for 500 milliseconds, so reserve space for anything slower. Hover and scroll earn no allowance, and a lab run usually misses these post-load shifts, so watch for them in the DevTools live view as you scroll and click, and in `largestShiftTarget` from your RUM.
Last, make pages eligible for the [back/forward cache](https://web.dev/articles/bfcache), which restores a page exactly as it was, with no shifts. The Chrome team said its introduction [produced the biggest CLS improvement of 2022](https://web.dev/articles/top-cwv). The usual blockers are `Cache-Control: no-store` and `unload` listeners; use the `pagehide` event instead, and `Permissions-Policy: unload=()` stops third-party code from adding one.
## What goes wrong on WordPress, Shopify and single-page apps?
The platform sets the floor and the implementation sets the result. In the [2025 Web Almanac CMS chapter](https://almanac.httparchive.org/en/2025/cms), 45% of WordPress sites had good Core Web Vitals on mobile against 74% on Wix, and the more tightly managed platforms gained most year over year while WordPress and Drupal gained about 4%.
- **WordPress and page builders.** About 60% of WordPress sites use a page builder, which the chapter links to more complex markup, larger bundles and, historically, weaker Core Web Vitals. Core already helps: since 6.3 it [adds `fetchpriority="high"` to the image it judges to be the LCP image](https://make.wordpress.org/core/2023/07/13/image-performance-enhancements-in-wordpress-6-3/), which typically improves LCP by 5% to 10%, so check that no plugin re-adds lazy loading to your first image. The [WordPress SEO guide](https://computese.com/wordpress-seo/) covers the rest.
- **Shopify themes.** Shopify lists [apps, third-party libraries, analytics libraries, theme code and the quantity and size of images and videos](https://help.shopify.com/en/manual/online-store/web-performance/overview) as what influences a store's performance. Its report samples the last seven days of visits from Chromium browsers and Firefox, so it will not match PageSpeed Insights, which uses opted-in Chrome only. The [Shopify SEO checklist](https://computese.com/shopify-seo/) covers the rest.
- **Single-page apps.** CrUX attributes a whole SPA session to its initial page view, so INP and CLS accumulate across route changes. Chrome 151 added soft-navigation APIs, and web-vitals 6.0.0 (July 21, 2026) can report per route with `reportSoftNavs: true`, but in web.dev's [August 2026 update](https://web.dev/articles/vitals-spa-faq) Chrome had not published a timeframe for using them in CrUX. Until it does, treat the first load as what Google's field data sees, and server-render it. In Next.js 16, [`priority` is deprecated in favour of `preload`](https://nextjs.org/docs/app/api-reference/components/image), and the docs advise `loading="eager"` or `fetchPriority="high"` in most cases.
- **Consent banners and tags.** A top-of-screen cookie notice is [a very common source of layout shift](https://web.dev/articles/cookie-notice-best-practices): reserve its space, or use a sticky footer or modal, which overlay the page. The Accept button often triggers a burst of third-party scripts and a slow interaction, so yield after the click. Load the notice's script directly in the HTML, not through a tag manager.
A decoupled front end changes where the work happens, not whether it is needed; the trade-offs are in our [headless CMS guide](https://computese.com/headless-cms/). A migration replaces tuned templates with new ones, so record field scores per template before and after, as in [website migration without losing SEO](https://computese.com/website-migration-seo/).
## A workflow for fixing failing URLs, in order
1. **Start in Search Console.** Open Core Web Vitals, pick Mobile and read the "Why URLs aren't considered good" table. Each example URL stands for a [group of similar URLs](https://support.google.com/webmasters/answer/9205520) rated by its worst metric. Only indexed URLs appear (see [web crawling and indexing](https://computese.com/web-crawling-and-indexing-explained/)) and the table holds 200 rows at most.
2. **Name the template and check one URL.** Search Console assumes a group shares a framework and a cause, so it is usually one template: product page, article, category. Test a representative URL in PageSpeed Insights and read the field section first, noting whether it shows URL or origin data.
3. **Get the cause from real visits.** Use the RUM attribution above: the LCP element and sub-part, the INP phase and target, the element behind the largest shift. With no RUM yet, reproduce in DevTools with CPU and network throttled to match the field data.
4. **Fix at the template level and verify in the lab.** Re-run the LCP breakdown, TBT and layout shifts, and hold the result with a performance budget in CI.
5. **Ship, then start tracking.** Click Start Tracking on the issue. Search Console monitors CrUX data for [28 days](https://support.google.com/webmasters/answer/9205520) and marks the issue fixed only if no URL has it throughout; the click does not trigger reindexing.
6. **Keep it fixed.** Regressions come from new tags, apps, A/B tests, consent changes and ad slots. Alert on your RUM 75th percentile instead of waiting for Search Console, and expect noise in December: CrUX says its [December data is highly variable](https://developer.chrome.com/docs/crux/release-notes) every year.
| Symptom | Likely cause | Confirm with | Fix |
| ------------------------------------ | --------------------------------------------------------------------------- | --------------------------------------------- | ----------------------------------------------------------------------------- |
| Poor LCP, large load delay | Hero injected by JavaScript, in `data-src`, a CSS background or lazy-loaded | Page source; Network priority column | `` in HTML, no lazy, `fetchpriority="high"`, preload for CSS backgrounds |
| Poor LCP, large TTFB | Uncached HTML, redirect chains, cache-busting parameters | TTFB in PageSpeed Insights or RUM | Edge-cache HTML, remove redirect hops |
| Poor LCP, large render delay | Blocking CSS or scripts, variant-hiding snippet, client-side rendering | Performance trace between download and paint | Trim or inline CSS, defer scripts, render on the server |
| Poor INP, input delay | Startup long tasks, timers, third-party tags | RUM `inputDelay`; trace | Split bundles, remove tags, break up tasks |
| Poor INP, processing or presentation | One heavy handler; huge DOM, forced layout | RUM `processingDuration`, `presentationDelay` | Show feedback, yield, use a worker; smaller DOM, `content-visibility` |
| Poor CLS | Images without dimensions, late banner, font swap, post-load shifts | Layout shift track; `largestShiftTarget` | Dimensions, reserved slot, metric-matched fallback |
| Good lab, poor field | Slower phones, cold caches, a different LCP element | Device split and LCP element in RUM | Throttle DevTools to match the field data |
> [!TIP]
> Expect the first weeks after a fix to look flat. CrUX data covers a trailing 28 days, so old slow visits stay in the window until they age out. Your own daily RUM shows the change first.
If you would rather have the template fixes made and held in place, our [web design and development](https://computese.com/services/web-design-development/) work enforces Core Web Vitals budgets in CI, and our [SEO service](https://computese.com/services/seo/) reviews Core Web Vitals by template from CrUX field data.
## Key terms
- **Core Web Vitals**: Google's set of three field metrics for loading (LCP), responsiveness (INP) and visual stability (CLS). A page passes when the 75th percentile of real visits is good on all three.
- **Largest Contentful Paint (LCP)**: The time from the start of navigation until the largest image, video frame or text block in the viewport is rendered. Good is 2.5 seconds or less.
- **Interaction to Next Paint (INP)**: The latency of the longest click, tap or key press during a visit, from the input until the browser paints the next frame, ignoring outliers. Good is 200 milliseconds or less.
- **Cumulative Layout Shift (CLS)**: A unitless score for unexpected movement of visible content, taken from the worst burst of layout shifts (a session window) in a page's life. Good is 0.1 or less.
- **75th percentile**: The value that 75% of visits meet or beat. Core Web Vitals are judged at this point so most visits reach the target without a few outliers deciding the result.
- **Chrome UX Report (CrUX)**: Google's dataset of field metrics from opted-in Chrome users. It feeds PageSpeed Insights and Search Console's Core Web Vitals report, over a trailing 28-day period.
- **Real user monitoring (RUM)**: Measuring performance on your own visitors' devices, for example with the web-vitals library. It shows which element, sub-part or interaction caused a slow metric.
- **Long task**: A task that keeps the browser's main thread busy for more than 50 milliseconds. Input arriving during a long task waits, which adds to INP.
- **Total Blocking Time (TBT)**: A lab metric: the sum, over every long task after First Contentful Paint, of the time beyond 50 milliseconds. A proxy for INP in tools that cannot interact with the page.
- **Back/forward cache (bfcache)**: A browser memory cache that restores a page exactly as the visitor left it when they go back or forward. A restored page loads instantly and shows no layout shifts.
## Common questions
### What are Core Web Vitals?
Core Web Vitals are three metrics Google uses to describe real-world user experience: Largest Contentful Paint for loading, Interaction to Next Paint for responsiveness and Cumulative Layout Shift for visual stability. They are measured on real visits and judged at the 75th percentile, separately for mobile and desktop. A page passes when all three are good.
### What is a good Core Web Vitals score?
Good means an LCP of 2.5 seconds or less, an INP of 200 milliseconds or less and a CLS of 0.1 or less at the 75th percentile. Poor starts above 4 seconds, 500 milliseconds and 0.25, and the range between is needs improvement. As of October 2026, web.dev and Search Console list the same values.
### Are Core Web Vitals a ranking factor?
Google says Core Web Vitals are used by its ranking systems and that there is no single page experience signal. It also says good scores do not guarantee top rankings and that it still shows the most relevant content when page experience is poor. Fix Poor URLs for your visitors; chasing a perfect score for SEO alone may not be the best use of your time.
### How do I check my Core Web Vitals?
Open the Core Web Vitals report in Search Console for field data grouped by similar URLs, then test a representative URL in PageSpeed Insights, which shows Chrome UX Report field data above a Lighthouse lab run. For the element, sub-part or interaction behind a slow score on real visits, add the web-vitals library to your pages.
### Why do PageSpeed Insights, Lighthouse and Search Console show different numbers?
Search Console groups similar URLs and rates a group by its worst metric, while PageSpeed Insights usually shows one URL, or the origin when the URL has too little data, and adds a Lighthouse lab run. Both field sets cover a trailing 28 days of Chrome visits. A lab run is one device on one network, so it can disagree with the 75th percentile of real visits.
### How long do Core Web Vitals fixes take to show in Search Console?
About four weeks. The Chrome UX Report data behind the report covers a trailing 28 days, and Search Console validation monitors for 28 days after you click Start Tracking. A fix passes only if the issue is absent from every URL for the whole window. Your own RUM data shows the change sooner.
### What replaced First Input Delay, and did anything change in 2026?
INP replaced FID as a Core Web Vital on March 12, 2024. As of October 2026, web.dev and Search Console both list the same thresholds: 2.5 seconds, 200 milliseconds and 0.1. Chrome 151 added APIs that measure Core Web Vitals across single-page app route changes, but Chrome had not published a date for using them in CrUX as of its August 2026 update.
## Sources
1. [Web Vitals](https://web.dev/articles/vitals), web.dev
2. [How the Core Web Vitals metrics thresholds were defined](https://web.dev/articles/defining-core-web-vitals-thresholds), web.dev
3. [Performance | 2025 | The Web Almanac](https://almanac.httparchive.org/en/2025/performance), HTTP Archive
4. [Largest Contentful Paint (LCP)](https://web.dev/articles/lcp), web.dev
5. [Interaction to Next Paint (INP)](https://web.dev/articles/inp), web.dev
6. [Cumulative Layout Shift (CLS)](https://web.dev/articles/cls), web.dev
7. [Introducing INP to Core Web Vitals](https://developers.google.com/search/blog/2023/05/introducing-inp), Google Search Central Blog
8. [Interaction to Next Paint becomes a Core Web Vital on March 12](https://web.dev/blog/inp-cwv-march-12), web.dev
9. [Understanding page experience in Google Search results](https://developers.google.com/search/docs/appearance/page-experience), Google Search Central
10. [Core Web Vitals report](https://support.google.com/webmasters/answer/9205520), Search Console Help
11. [Why lab and field data can be different (and what to do about it)](https://web.dev/articles/lab-and-field-data-differences), web.dev
12. [About PageSpeed Insights](https://developers.google.com/speed/docs/insights/v5/about), Google for Developers
13. [CrUX methodology](https://developer.chrome.com/docs/crux/methodology), Chrome for Developers
14. [Performance panel: Analyze your website's performance](https://developer.chrome.com/docs/devtools/performance/overview), Chrome DevTools
15. [web-vitals](https://github.com/GoogleChrome/web-vitals), GoogleChrome on GitHub
16. [Optimize Largest Contentful Paint](https://web.dev/articles/optimize-lcp), web.dev
17. [Optimize resource loading with the Fetch Priority API](https://web.dev/articles/fetch-priority), web.dev
18. [The most effective ways to improve Core Web Vitals](https://web.dev/articles/top-cwv), web.dev
19. [Optimize Time to First Byte](https://web.dev/articles/optimize-ttfb), web.dev
20. [Optimize Interaction to Next Paint](https://web.dev/articles/optimize-inp), web.dev
21. [Optimize long tasks](https://web.dev/articles/optimize-long-tasks), web.dev
22. [Scheduler: yield() method](https://developer.mozilla.org/en-US/docs/Web/API/Scheduler/yield), MDN Web Docs
23. [Optimize input delay](https://web.dev/articles/optimize-input-delay), web.dev
24. [content-visibility: the new CSS property that boosts your rendering performance](https://web.dev/articles/content-visibility), web.dev
25. [Total Blocking Time (TBT)](https://web.dev/articles/tbt), web.dev
26. [Optimize Cumulative Layout Shift](https://web.dev/articles/optimize-cls), web.dev
27. [Improved font fallbacks](https://developer.chrome.com/blog/font-fallbacks), Chrome for Developers
28. [ascent-override CSS at-rule descriptor](https://developer.mozilla.org/en-US/docs/Web/CSS/Reference/At-rules/@font-face/ascent-override), MDN Web Docs
29. [Back/forward cache](https://web.dev/articles/bfcache), web.dev
30. [Best practices for cookie notices](https://web.dev/articles/cookie-notice-best-practices), web.dev
31. [Best practices for tags and tag managers](https://web.dev/articles/tag-best-practices), web.dev
32. [CMS | 2025 | The Web Almanac](https://almanac.httparchive.org/en/2025/cms), HTTP Archive
33. [Image performance enhancements in WordPress 6.3](https://make.wordpress.org/core/2023/07/13/image-performance-enhancements-in-wordpress-6-3/), Make WordPress Core
34. [Overview of web performance](https://help.shopify.com/en/manual/online-store/web-performance/overview), Shopify Help Center
35. [How SPA architectures affect Core Web Vitals](https://web.dev/articles/vitals-spa-faq), web.dev
36. [Image Component](https://nextjs.org/docs/app/api-reference/components/image), Next.js
37. [Release notes](https://developer.chrome.com/docs/crux/release-notes), Chrome UX Report, Chrome for Developers
 ```
web.dev says to [never lazy-load the LCP image](https://web.dev/articles/optimize-lcp) and to give `fetchpriority="high"` to one or two images at most, because more makes the hint useless. In a test that rewrote the Google Flights page with Cloudflare Workers, [the hint moved LCP from 2.6 to 1.9 seconds](https://web.dev/articles/fetch-priority); all three major engines support it, Firefox since version 132 and Safari since 17.2. The 2025 Web Almanac found about 16% to 17% of pages still lazy-loading their LCP image.
### Element render delay: stop blocking the paint
All browsers render images on the main thread, so anything that holds it up delays the paint even after the file arrives. The usual causes are a stylesheet slower to load than the image (inline it if it is small, otherwise remove unused rules and defer non-critical CSS), synchronous scripts in the ``, content that only exists once JavaScript has run, an A/B-testing library hiding the element until it picks a variant, and long tasks. Render the LCP content on the server: [server-side rendering puts the image in the HTML](https://web.dev/articles/optimize-lcp) and removes the wait for scripts. It costs extra server time, so prerender at build time where the architecture allows.
### Resource load duration: send fewer bytes from nearer
This is rarely the bottleneck. web.dev warns that load duration tends not to be a significant one, and the Chrome team found that [most origins with poor LCP spend under 10% of their 75th percentile LCP downloading the image](https://web.dev/articles/top-cwv). Check the sub-part before compressing anything. If it is large, send the size the screen needs with `srcset` and `sizes`, use AVIF or WebP, host the image on the page's own origin or preconnect to its origin, and set a long cache lifetime so repeat visits skip the network. Compress text assets too; our guide to [data compression algorithms](https://computese.com/revolutionary-data-compression-algorithm/) explains Brotli and gzip.
### Time to First Byte: cache the HTML
Nothing starts until the first byte arrives, so every other sub-part inherits a slow TTFB. It is not a Core Web Vital, but [0.8 seconds or less](https://web.dev/articles/optimize-ttfb) is a sound rule of thumb. Common causes are redirect chains (link shorteners, ad and newsletter links), HTML that never gets served from a CDN edge, and unique analytics query parameters that make the cache treat every visit as a new page. Cache HTML at the edge even briefly, cut redirect hops, and keep tracking parameters from bypassing the cache. The Chrome team also recommends [aiming for instant navigations](https://web.dev/articles/top-cwv): a page prerendered with the Speculation Rules API shows a near-zero LCP, and one restored from the back/forward cache appears exactly as the user left it.
## How do you fix a poor INP?
INP is the sum of three phases, and the fix depends on which one dominates. The attribution data above reports all three, and [web.dev defines them](https://web.dev/articles/optimize-inp) this way:
| Phase | What it is | Usual causes | Fixes |
| ------------------- | -------------------------------------------- | -------------------------------------------------------------------------------------------- | -------------------------------------------------------------------------- |
| Input delay | Input until event handlers start | Long tasks, startup script evaluation, timers, overlapping interactions, third-party scripts | Ship less JavaScript, split bundles, break up tasks, drop recurring timers |
| Processing duration | Event handlers running | Heavy handlers doing all their work before the next paint | Do the minimum visible work, then yield; move computation to a web worker |
| Presentation delay | Handlers finished until the next frame shows | Large DOM, forced layout | Smaller DOM, `content-visibility`, batch DOM reads and writes |
The main thread runs one task at a time, any task over 50 milliseconds is a [long task](https://web.dev/articles/optimize-long-tasks), and an interaction that arrives mid-task waits for it.

*A tap cannot jump the queue: while one long task holds the main thread, the screen cannot show any response to it.*
Break the work up and yield, putting the visible change before the yield so the browser can paint it:
```js
function yieldToMain() {
if (globalThis.scheduler?.yield) return scheduler.yield();
return new Promise((resolve) => setTimeout(resolve, 0)); // fallback
}
saveButton.addEventListener("click", async () => {
showSpinner(); // the feedback the visitor needs in the next frame
await yieldToMain(); // lets the browser paint and handle other input
await saveToServer(); // the slow work runs in a later task
});
```
`scheduler.yield()` runs the continuation before other queued tasks, so [tasks from third-party scripts](https://web.dev/articles/optimize-long-tasks) cannot cut in ahead of it, which a `setTimeout` fallback cannot promise. It works in Chrome and Edge 129 and Firefox 142, not in Safari, and [MDN lists it as limited availability](https://developer.mozilla.org/en-US/docs/Web/API/Scheduler/yield) (not Baseline) as of October 2026, so keep the fallback. web.dev no longer recommends `isInputPending()`.
Doing less beats doing it in pieces. Ship only the JavaScript the first render needs and prune tags: web.dev has seen a [correlation between the size of tag managers and poorer INP](https://web.dev/articles/tag-best-practices). For typeahead fields, [debounce the input and cancel stale requests](https://web.dev/articles/optimize-input-delay) with `AbortController`.
For presentation delay, large DOMs make every update expensive. [`content-visibility: auto`](https://web.dev/articles/content-visibility) skips rendering work for off-screen sections and became Baseline "newly available" on September 15, 2025. Pair it with a size estimate so the scrollbar does not jump:
```css
.comment {
content-visibility: auto;
contain-intrinsic-size: auto 300px; /* estimate; the browser remembers the real size */
}
```
In the lab, [Total Blocking Time](https://web.dev/articles/tbt) sums the time beyond 50 milliseconds of every long task after First Contentful Paint, and web.dev suggests staying under 200 milliseconds on average mobile hardware. It cannot see when visitors really tap, so judge INP from field data and use the DevTools live metrics view to reproduce the slow interaction the field data points to.
## How do you fix layout shift (CLS)?
web.dev lists [four common causes](https://web.dev/articles/optimize-cls): images without dimensions, ads and embeds without dimensions, dynamically injected content, and web fonts. The first is the cheapest to fix and still widespread: the 2025 Web Almanac found 62% of mobile pages failing to set explicit dimensions on at least one image. Give images and video `width` and `height`, which browsers turn into a default aspect ratio before the file loads, and reserve space for everything else:
```css
/* with
```
web.dev says to [never lazy-load the LCP image](https://web.dev/articles/optimize-lcp) and to give `fetchpriority="high"` to one or two images at most, because more makes the hint useless. In a test that rewrote the Google Flights page with Cloudflare Workers, [the hint moved LCP from 2.6 to 1.9 seconds](https://web.dev/articles/fetch-priority); all three major engines support it, Firefox since version 132 and Safari since 17.2. The 2025 Web Almanac found about 16% to 17% of pages still lazy-loading their LCP image.
### Element render delay: stop blocking the paint
All browsers render images on the main thread, so anything that holds it up delays the paint even after the file arrives. The usual causes are a stylesheet slower to load than the image (inline it if it is small, otherwise remove unused rules and defer non-critical CSS), synchronous scripts in the ``, content that only exists once JavaScript has run, an A/B-testing library hiding the element until it picks a variant, and long tasks. Render the LCP content on the server: [server-side rendering puts the image in the HTML](https://web.dev/articles/optimize-lcp) and removes the wait for scripts. It costs extra server time, so prerender at build time where the architecture allows.
### Resource load duration: send fewer bytes from nearer
This is rarely the bottleneck. web.dev warns that load duration tends not to be a significant one, and the Chrome team found that [most origins with poor LCP spend under 10% of their 75th percentile LCP downloading the image](https://web.dev/articles/top-cwv). Check the sub-part before compressing anything. If it is large, send the size the screen needs with `srcset` and `sizes`, use AVIF or WebP, host the image on the page's own origin or preconnect to its origin, and set a long cache lifetime so repeat visits skip the network. Compress text assets too; our guide to [data compression algorithms](https://computese.com/revolutionary-data-compression-algorithm/) explains Brotli and gzip.
### Time to First Byte: cache the HTML
Nothing starts until the first byte arrives, so every other sub-part inherits a slow TTFB. It is not a Core Web Vital, but [0.8 seconds or less](https://web.dev/articles/optimize-ttfb) is a sound rule of thumb. Common causes are redirect chains (link shorteners, ad and newsletter links), HTML that never gets served from a CDN edge, and unique analytics query parameters that make the cache treat every visit as a new page. Cache HTML at the edge even briefly, cut redirect hops, and keep tracking parameters from bypassing the cache. The Chrome team also recommends [aiming for instant navigations](https://web.dev/articles/top-cwv): a page prerendered with the Speculation Rules API shows a near-zero LCP, and one restored from the back/forward cache appears exactly as the user left it.
## How do you fix a poor INP?
INP is the sum of three phases, and the fix depends on which one dominates. The attribution data above reports all three, and [web.dev defines them](https://web.dev/articles/optimize-inp) this way:
| Phase | What it is | Usual causes | Fixes |
| ------------------- | -------------------------------------------- | -------------------------------------------------------------------------------------------- | -------------------------------------------------------------------------- |
| Input delay | Input until event handlers start | Long tasks, startup script evaluation, timers, overlapping interactions, third-party scripts | Ship less JavaScript, split bundles, break up tasks, drop recurring timers |
| Processing duration | Event handlers running | Heavy handlers doing all their work before the next paint | Do the minimum visible work, then yield; move computation to a web worker |
| Presentation delay | Handlers finished until the next frame shows | Large DOM, forced layout | Smaller DOM, `content-visibility`, batch DOM reads and writes |
The main thread runs one task at a time, any task over 50 milliseconds is a [long task](https://web.dev/articles/optimize-long-tasks), and an interaction that arrives mid-task waits for it.

*A tap cannot jump the queue: while one long task holds the main thread, the screen cannot show any response to it.*
Break the work up and yield, putting the visible change before the yield so the browser can paint it:
```js
function yieldToMain() {
if (globalThis.scheduler?.yield) return scheduler.yield();
return new Promise((resolve) => setTimeout(resolve, 0)); // fallback
}
saveButton.addEventListener("click", async () => {
showSpinner(); // the feedback the visitor needs in the next frame
await yieldToMain(); // lets the browser paint and handle other input
await saveToServer(); // the slow work runs in a later task
});
```
`scheduler.yield()` runs the continuation before other queued tasks, so [tasks from third-party scripts](https://web.dev/articles/optimize-long-tasks) cannot cut in ahead of it, which a `setTimeout` fallback cannot promise. It works in Chrome and Edge 129 and Firefox 142, not in Safari, and [MDN lists it as limited availability](https://developer.mozilla.org/en-US/docs/Web/API/Scheduler/yield) (not Baseline) as of October 2026, so keep the fallback. web.dev no longer recommends `isInputPending()`.
Doing less beats doing it in pieces. Ship only the JavaScript the first render needs and prune tags: web.dev has seen a [correlation between the size of tag managers and poorer INP](https://web.dev/articles/tag-best-practices). For typeahead fields, [debounce the input and cancel stale requests](https://web.dev/articles/optimize-input-delay) with `AbortController`.
For presentation delay, large DOMs make every update expensive. [`content-visibility: auto`](https://web.dev/articles/content-visibility) skips rendering work for off-screen sections and became Baseline "newly available" on September 15, 2025. Pair it with a size estimate so the scrollbar does not jump:
```css
.comment {
content-visibility: auto;
contain-intrinsic-size: auto 300px; /* estimate; the browser remembers the real size */
}
```
In the lab, [Total Blocking Time](https://web.dev/articles/tbt) sums the time beyond 50 milliseconds of every long task after First Contentful Paint, and web.dev suggests staying under 200 milliseconds on average mobile hardware. It cannot see when visitors really tap, so judge INP from field data and use the DevTools live metrics view to reproduce the slow interaction the field data points to.
## How do you fix layout shift (CLS)?
web.dev lists [four common causes](https://web.dev/articles/optimize-cls): images without dimensions, ads and embeds without dimensions, dynamically injected content, and web fonts. The first is the cheapest to fix and still widespread: the 2025 Web Almanac found 62% of mobile pages failing to set explicit dimensions on at least one image. Give images and video `width` and `height`, which browsers turn into a default aspect ratio before the file loads, and reserve space for everything else:
```css
/* with